With the recent addition of access to a 10-year hindcast dataset within Mermaid we thought it would be a good idea to provide some handy guidance and advice on how it should be used.
The general aim of this dataset is to allow users to generate some ‘headline’ average duration statistics that will be useful for things such as writing or reviewing bids and operation overviews.
The key things to be aware of with this dataset are threefold:
- The duration of the dataset is ten years (January 2006 to December 2015)
- The time step of the wind data is three hours whereas it is six hours for the wave data
- The horizontal grid resolution is 0.25°, i.e. there are data points approximately every 27km
A ten-year dataset is the absolute minimum that you want to be using to generate meaningful operation duration statistics. You want to be running your Mermaid model of your operation enough times during the past so that you have sufficient data from which your results are calculated. If you have 20-30 years of time series data to test against then you will have more data to test your model against and therefore can have more confidence in the resulting duration statistics.
Wave height data at a six-hourly interval will be a highly-smoothed dataset. By that we mean the inter-hourly variability of the wave climate will not be well represented. The consequence of this is that there could be short periods where thresholds could have been exceeded but will not be captured in the Mermaid analysis. This will be more of an issue if you are modelling a lot of tasks that are short duration, rather than looking for larger weather windows.
The horizontal grid resolution will only be a concern if you are operating within 20-30 km of the coast, in shallow waters, or if in enclosed seas. This is because a coarse model grid will not capture the finer details of fetch lengths, changing coastlines and small islands, and so will not provide an accurate representation of the sea state.
To provide some confidence in the data we have run some Mermaid analyses using both this data and a longer and higher resolution commercially available dataset that we consider to be of a higher quality, and then compared the results.
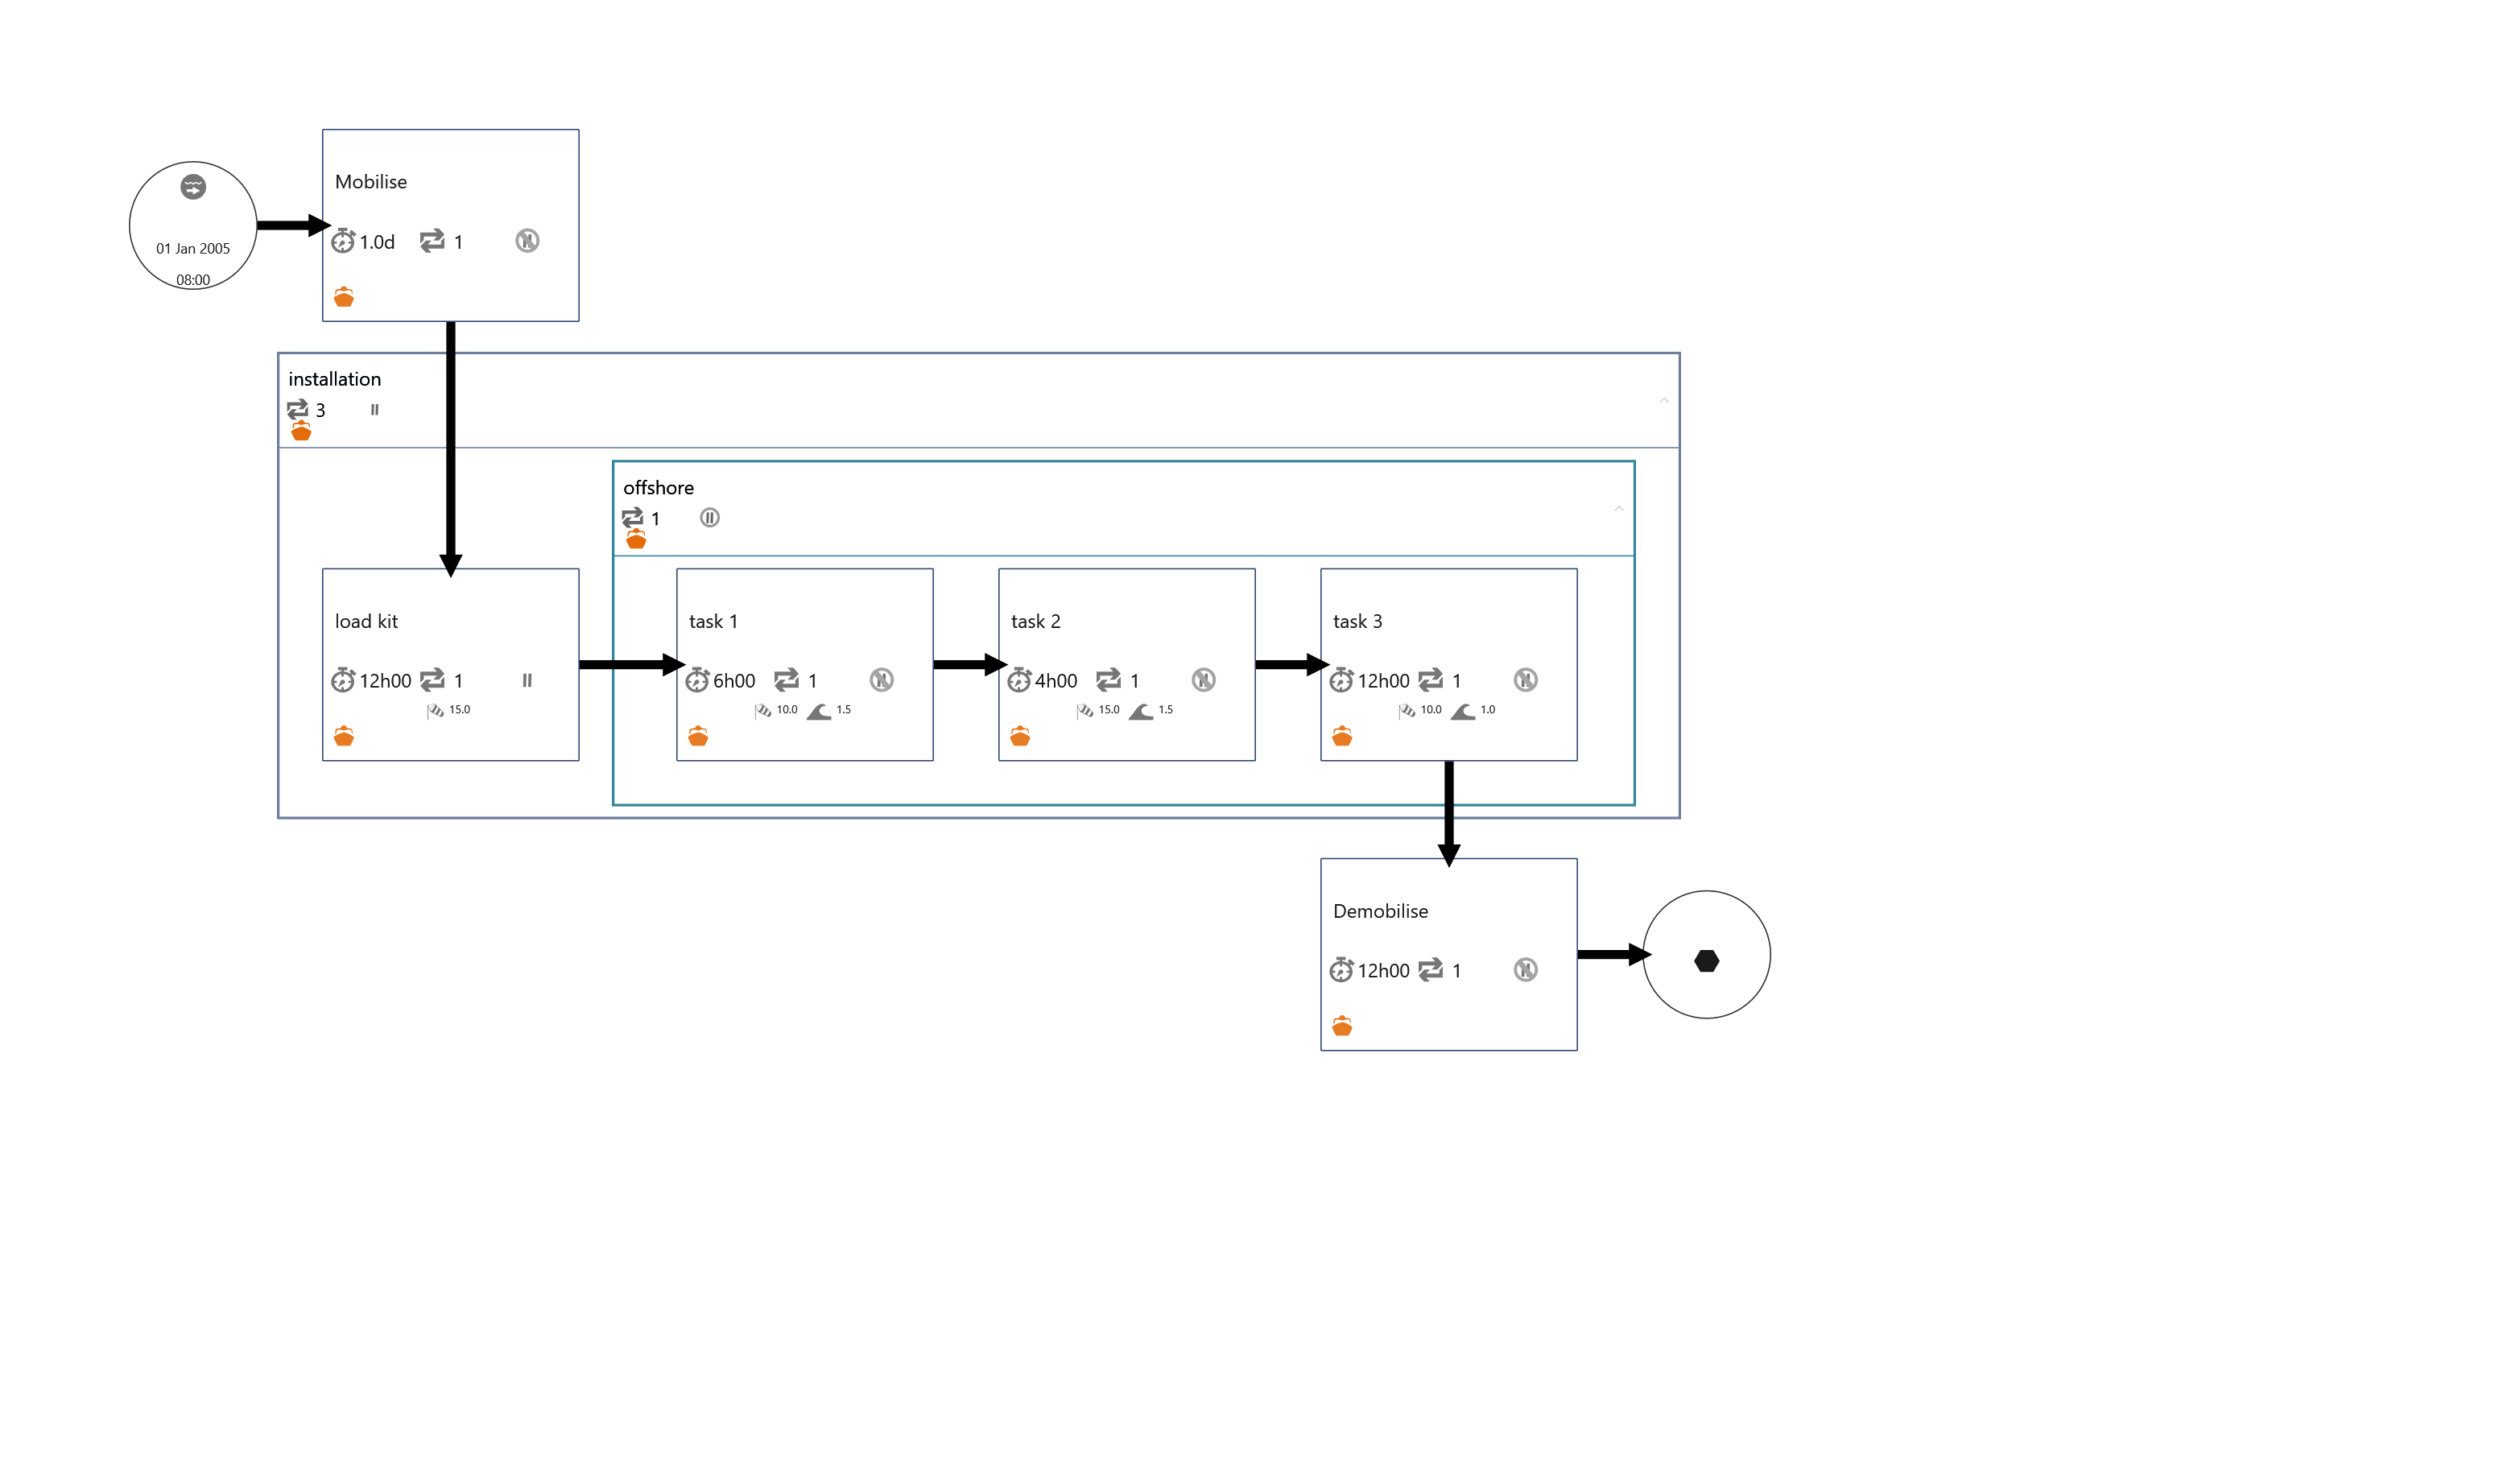
The flow diagram of the operations is presented below; it essentially consists of four tasks being repeated at three sites together with a mobilisation and demobilisation. Task lengths range from four hours to one day and the overall duration is slightly less than six days.
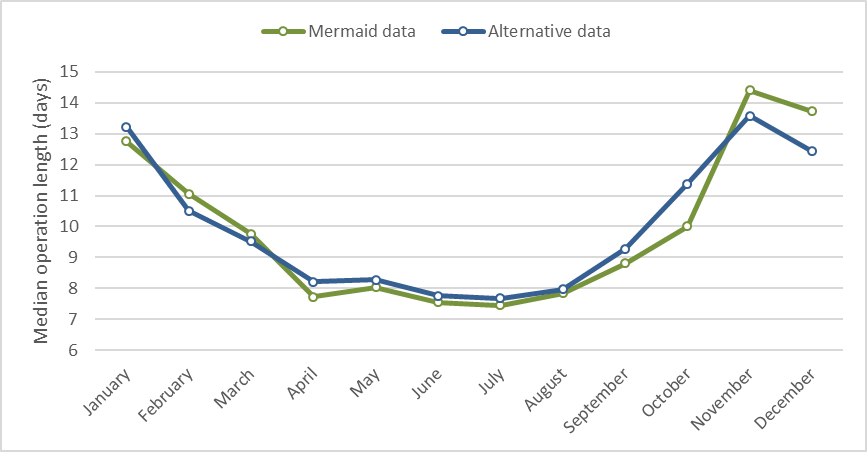
The figure below presents the duration Box and Whisker plots for the two analyses. In addition, there is a line graph that compares just the P50 (median) operation lengths.
It can be clearly seen that the two sets of statistics are very similar for most months of the year. In particular, the median operation lengths are within 0.5 days of each other for nine out of the twelve months. The more significant differences in the longer durations (P75 and maximums) is likely because the alternative dataset is longer. There are more years to sample from and so there will be a better defined P25-P75 range (i.e. the size of the box) and it is probable that there are more extreme weather periods to produce longer maximum durations. Despite this, the Mermaid dataset provides a good representation of the average durations likely for this operation.

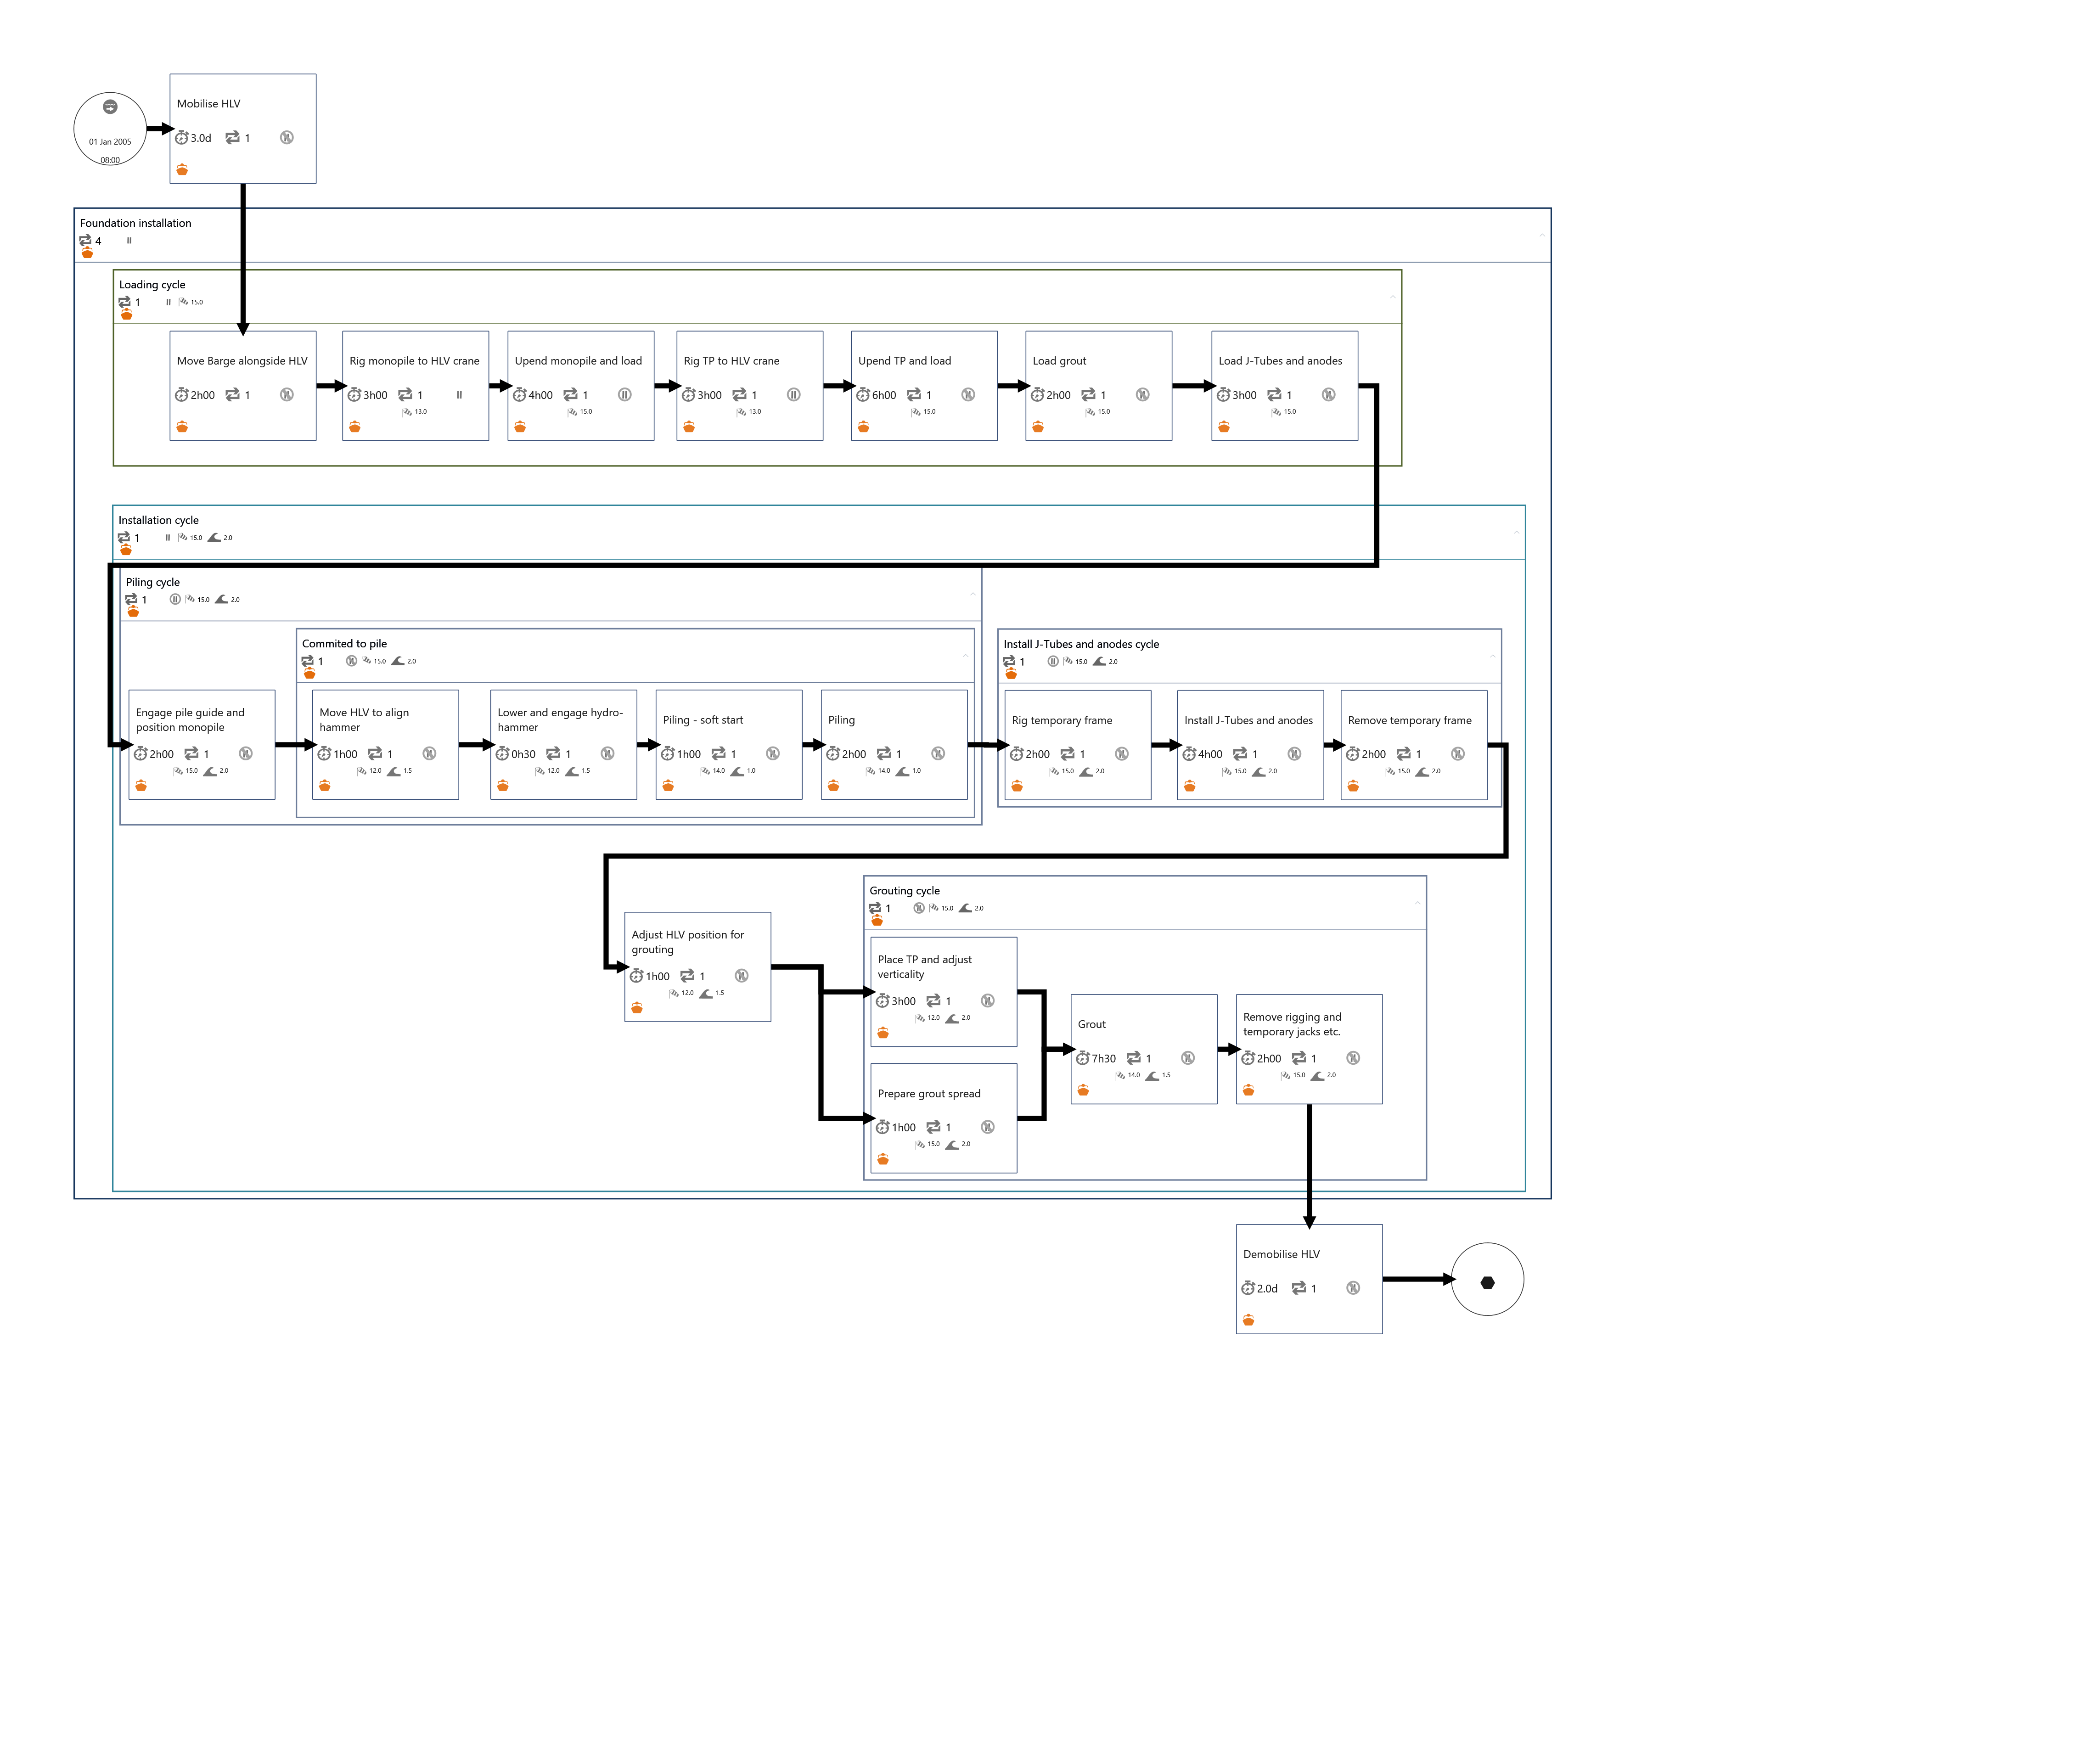
Following these results we have taken the dataset comparison further to see how the Mermaid metocean data performs for longer and more complicated operational set ups. We have taken one of the Mermaid case studies used in our training material and applied it to both the Mermaid data and the alternative dataset. The operation flow diagram is shown below. This time there are twenty-two tasks of different suspendabilities and weather limits, ranging between thirty minutes and three days with an overall duration of just over sixteen days.
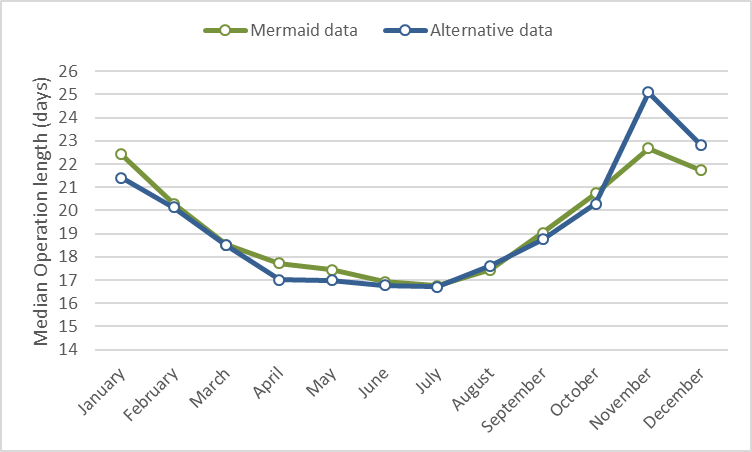
The results presented are again a comparison of the duration box and whisker plots and a closer comparison of the median durations. Once more we can see that, actually, for the more complicated operational set up, the Mermaid data has provided a relatively similar set of results to the alternative higher quality dataset. The median durations especially are very close, with 11 out of 12 months being within 1.1 days of each other.
The P25 and P75 results do start to diverge in the autumn and winter months caused by the higher level of variability in the weather data and the differences in the datasets.

Overall, this quick comparison between the new Mermaid held metocean data and a higher quality metocean dataset has shown that the Mermaid data provides very similar P50 values for both a simple and a more complex operation. Estimates of the longer durations do start to differ, again especially in the winter months. This does imply that care should be taken if you want accurate estimates of your operation duration at higher percentiles.
It should also be noted that this comparison has been made at only one location and against one other commercially available model dataset that we consider to be of a higher quality. Comparing Mermaid results at other locations, with other datasets and for different operational specification may provide entirely different results.
If you want to discuss data options for your own Mermaid analyses then please do get in touch and we can advise.