This is the first in a series of articles where we take a look at some of the challenges facing the development of floating wind and how Mermaid can be used to provide some answers and actionable intelligence.
Introduction
copyright Morek Engineering 2020
As the development of Floating Offshore Wind Farms (FLOW) gathers pace from pilot projects to the planning of whole arrays there are a range of new technical challenges that need to be met. One of these is the assessment of how vessels can access a floating turbine during O&M activities. The access of FLOW platforms is a challenging one, the key to understanding the level of risk to personnel is in interpreting the relative motion between the ‘small’ access vessel and the ‘massive’ FLOW structure.
We asked Morek Engineering to offer their insight of these offshore dynamics to help characterise likely weather limits.
In this analysis we illustrate how Mermaid can be used to compare and contrast vessel access statistics for a fixed wind platform against two different theoretical floating wind platforms. This straight forward model has been constructed to show how the turbine access and working criteria, based on wave height and period, impacts basic operability statistics such as:
- Number of workable days per month;
- How long to complete a 5-day O&M campaign.
This analysis should not be used to inform operational decision making but serves as a demonstration of how Mermaid can be used to compare and contrast different access options to help optimise a wind farm’s operation.
Model set up – location and schedule
A model has been built to simulate a typical day’s maintenance work at a wind farm offshore of St.Nazaire, France. It consists of:
- Mobilisation and transit to site;
- Weather window to allow crew transfer on to a number of platforms;
- Weather window to complete 4-hours of nacelle level maintenance tasks, where work can be stopped and started for weather;
- Weather window for crew transfer;
- Transit back to port;
- Offshore operations limited to during the day, 0800 to 1800.
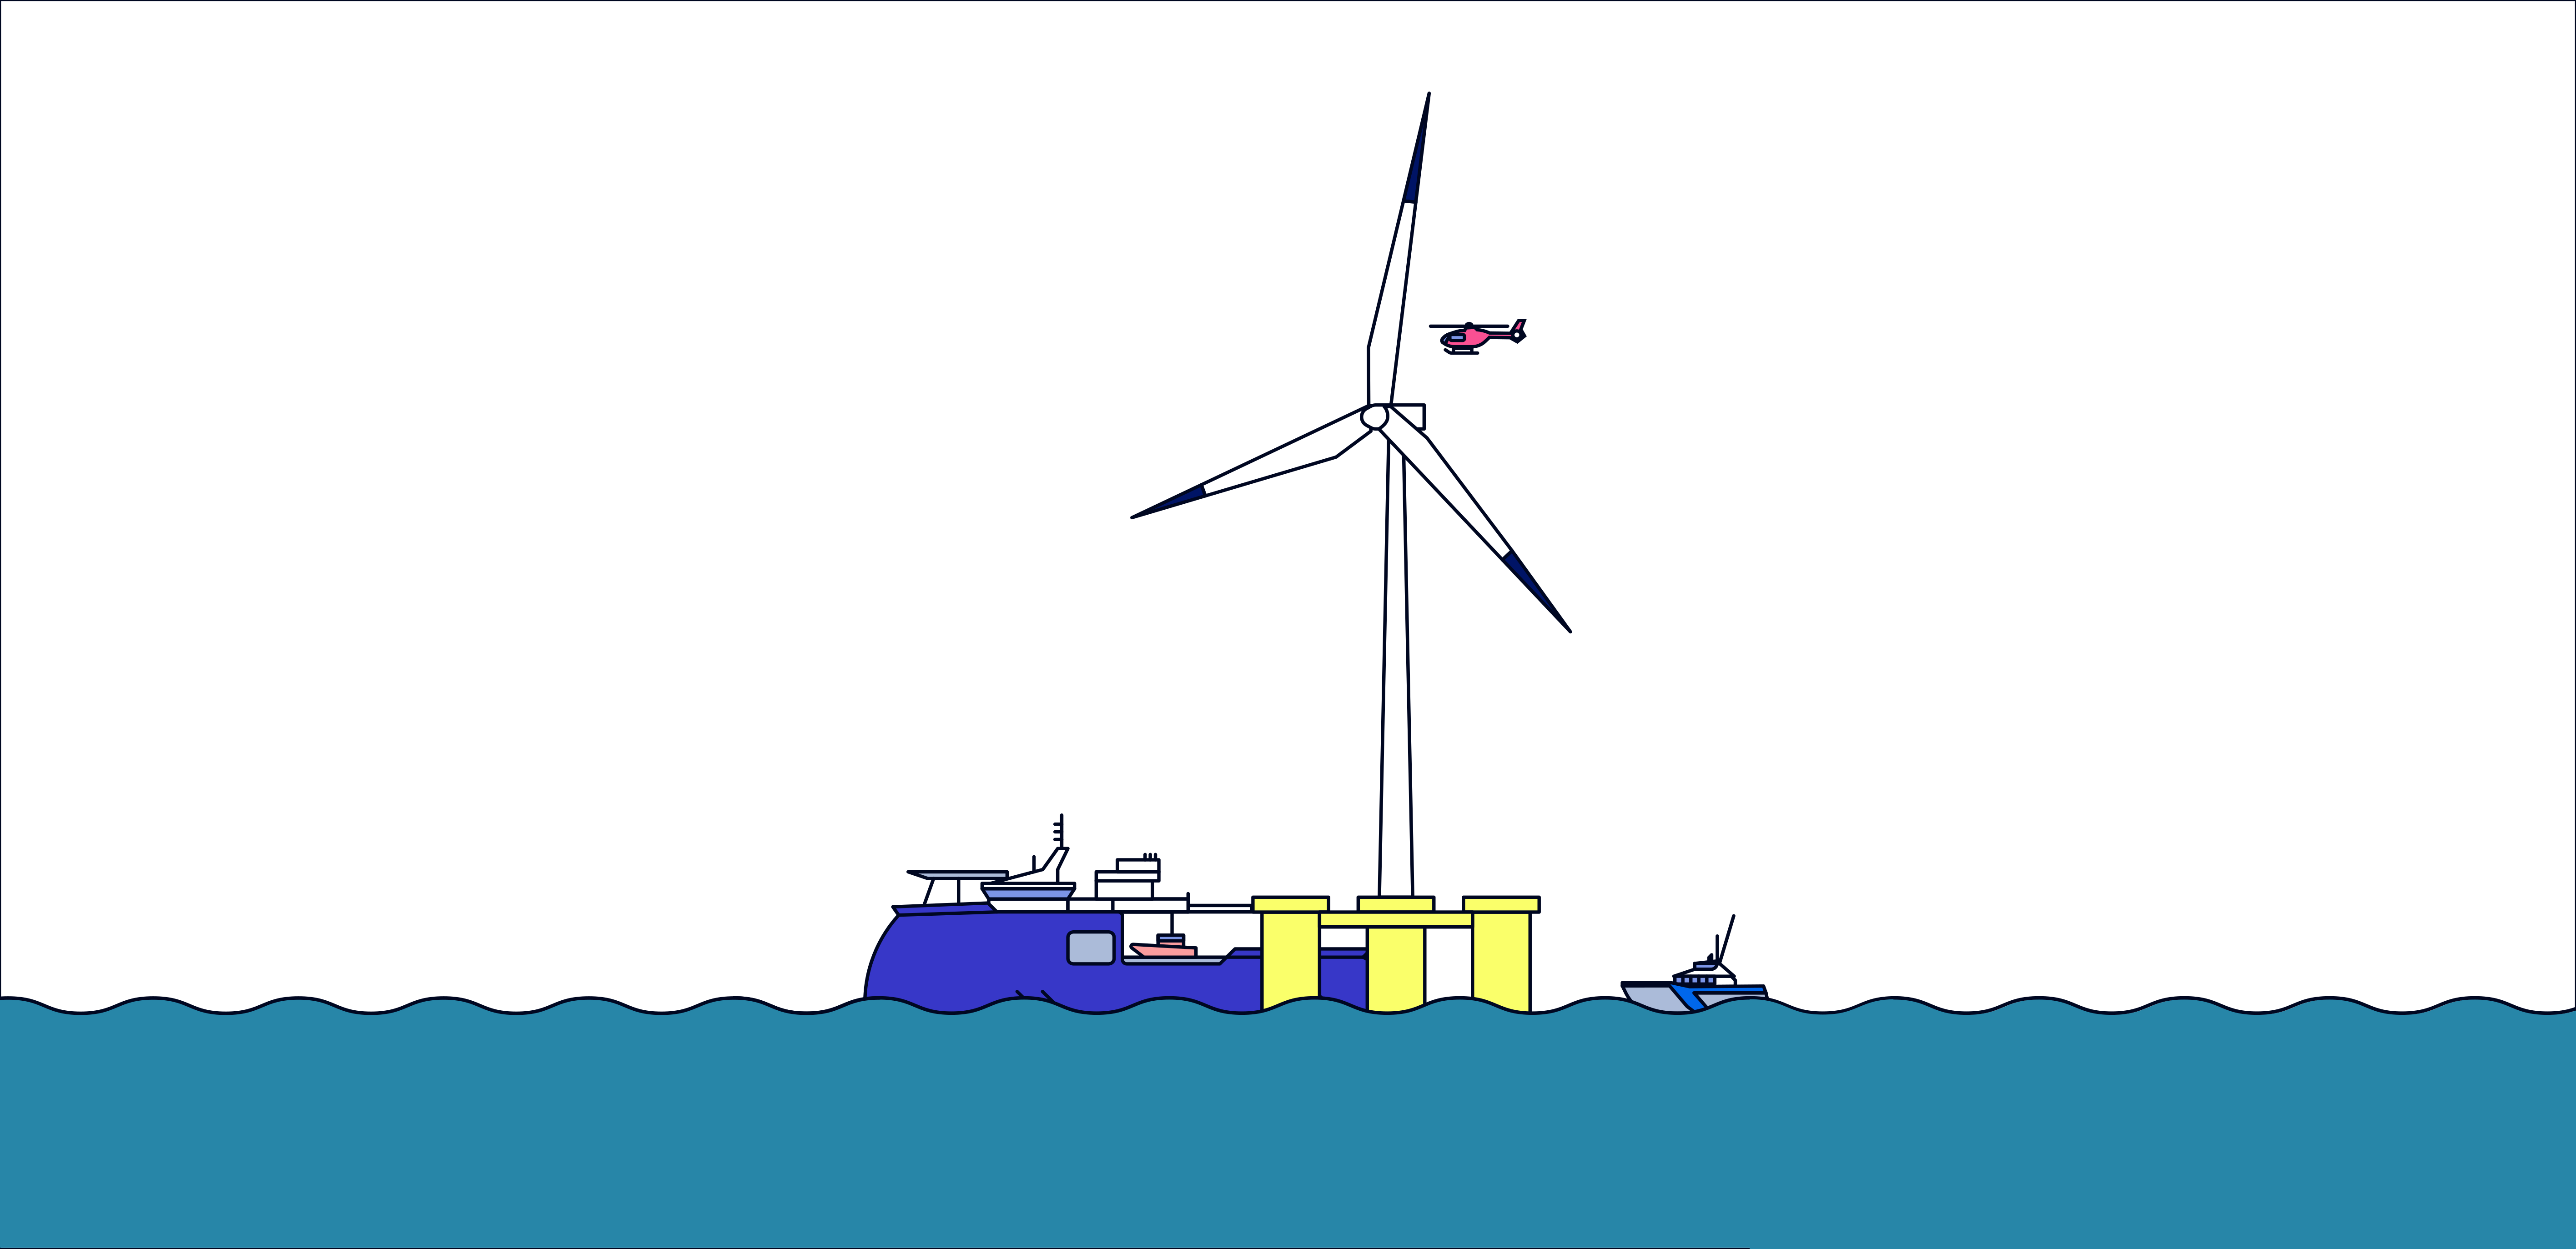
A map of the operations and the Mermaid task flow diagram are shown in the figures below.

Figure 1. Map of model set up
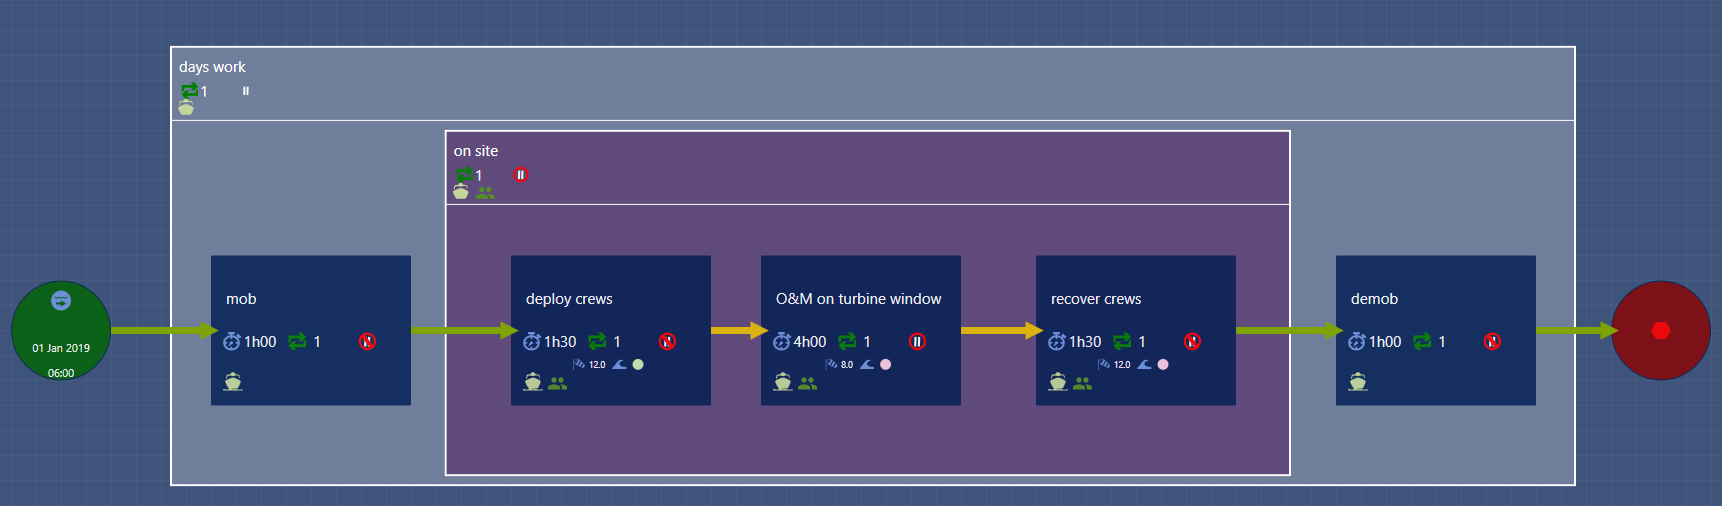
Figure 2. Mermaid flow diagram of operation tasks
Model set up – weather limits for platform types
In this instance we look at a conventional CTV accessing the FLOW turbine. To account for different platform types, the access and maintenance work are limited by different wave height, wave period and wind speeds. Within Mermaid this can be effectively characterised with an interdependent wave height and wave period access limit, for this study the two floating platforms have differing limits.
The turbine accessibility wave height and period (hs-tp) relationships have been set up to show two troughs in operability – one to replicate where a Crew Transer Vessel (CTV) is resonating but the platform is stable and the second where both CTV and platform are resonating out of sync. The hs-tp relationship for when working at nacelle level is more of a step function and shows a higher sensitivity to wave periods between 4 and 11 seconds. The two variations of these relationships have been derived to represent slightly differing types of floating platform, these are not generated from direct modelling but could perhaps show the difference between floaters suitable for a 7.5MW and 12MW turbine, or different foundation and mooring types.
For the fixed platform a wave height limit is only used for access and not at all for the maintenance task. These limits and hs-tp relationships are shown in table and figures below.
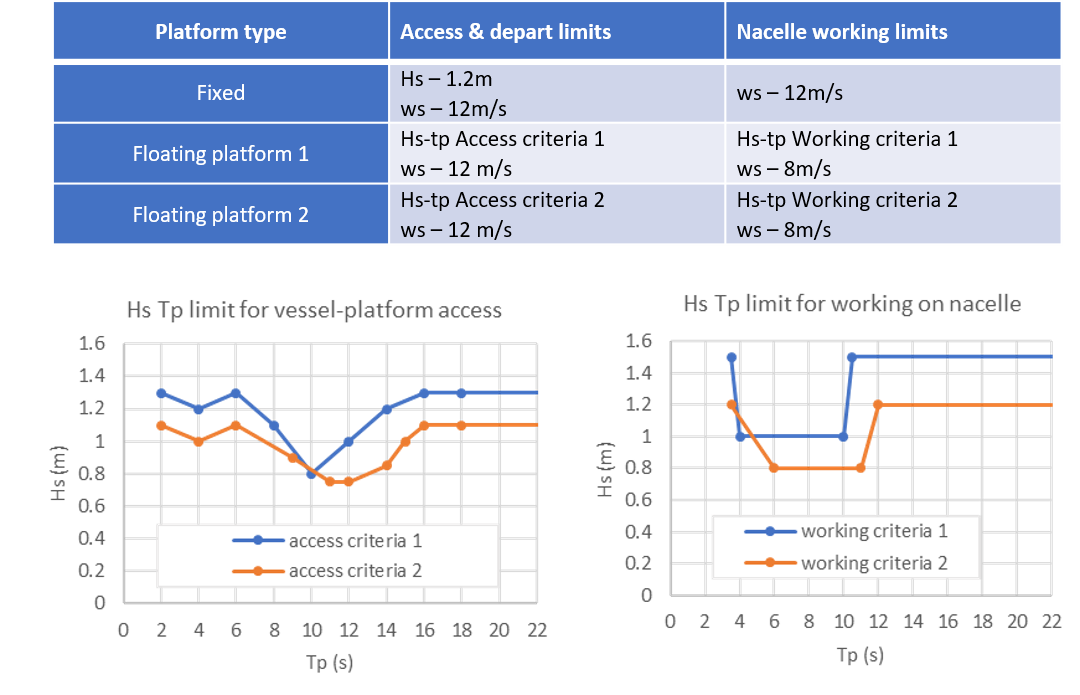
Table 1 / Figure 3. Wave height, period and wind speed limits for different platforms
Model set up – time series data and temporal analysis
We have used 16-years (2003-2018) of high-resolution hindcast wave and atmospheric model data, sourced from the DHI metocean data portal.
The Mermaid model has been run in two ways. The first has been to determine statistics on how many workable days are likely to occur in a given month. i.e. on how many days would it be successful in completing the day’s work as described.
The second method has been to use Mermaid to calculate statistics on how long it would take to complete a small O&M campaign of 5-days work.
Results
Number of workable days per month
The plot below shows the results of the first analysis in Mermaid. This has calculated how many likely working days per month there would be for the three different platform types.
The results clearly show how, with the limits given, the access and workability are reduced with the more stringent accessibility criteria of the floating platforms.
The difference between the platform types is largest in the summer months. There are more than 6 days per month more workable for the fixed platform than the second type of floating platform between May and August.
This is possibly due to the makeup of the summer wave height and period climate, or that in winter the results are more similar as conditions are poor enough that the difference in limits is less of an impact.
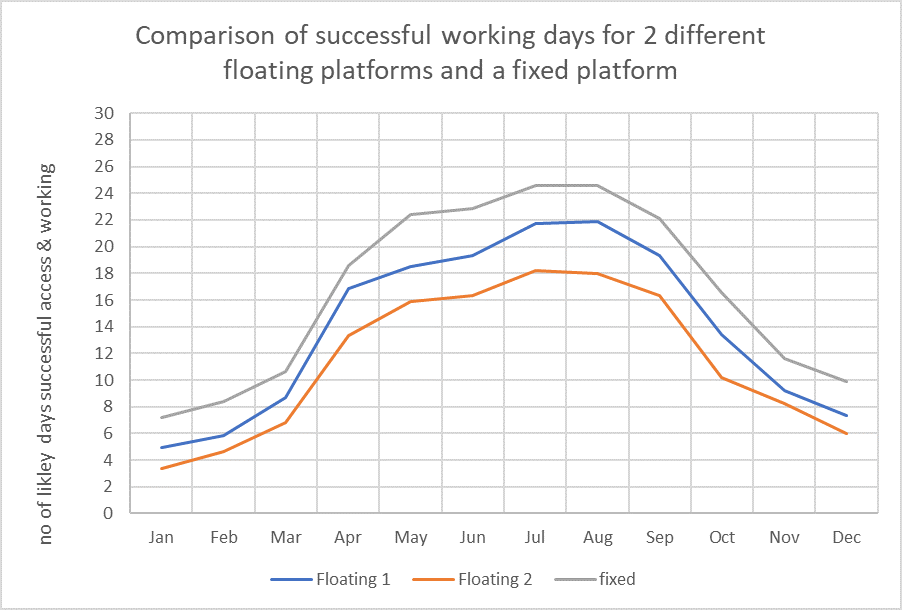
Figure 4. Average number of working days per month for different platform types
O&M campaign duration
The second analysis in Mermaid has been to calculate how long it is likely to take to complete five days of maintenance on the wind farm. This has been achieved by modelling the activities starting multiple times throughout each month of the time series data and calculating how long it would have taken in the given weather conditions.
The figure below shows the monthly Box and Whisker plots of the campaigns for the three platform types. These plots show the minimum, P25, P50, P75 and maximum durations. They clearly show how there is potential for a very large range of durations when completing this kind of campaign from late autumn to early spring with the addition of significant differences between the platform types. In particular it can be seen that the floating platform with the second hs-tp access relationship could have considerable downtime with P75 values in excess of 40 days between November and February.
Assessments of total operation duration adds valuable further intelligence beyond the simpler analysis of successful working days. It allows the user to understand the likelihood of achieving multiple successful days and how long it could take to complete the full operation. For example, whilst the fixed platform type has on average 7 successful working days a month in January, it would not be possible to ascertain from this that there is a 75% chance it could take up to 40 days to complete 5 days work.

Figure 5. Box and Whisker plot showing duration statistics for 5-day O&M campaign for different platform types
Summary
In this example we have clearly shown how Mermaid can be used in a relatively simple manner to compare and contrast three different platform types with different access criteria based on the wave height and period, to reflect the differences in motion and relative motion of platform and transfer vessel.
It has shown how there is a clear range of accessibility across the options and across the year with some performing significantly better than others. The information provided here shows that during late autumn and winter months there would be significant challenges in achieving even moderate duration O&M campaigns for all platforms, but more so for the floating types. It has also shown how interdependent weather limits provide an important insight into the overall availability and level of safety for access of FLOW platforms and more work must be conducted to understand the relative dynamics of the platform and access vessel, with plenty of scope for innovation in methods and technology to increase operability.
Early stage consideration of operational limitations can have a significant impact on the overall economics of the wind farm. As with any mechanical system the reliability is fundamentally defined very early in the design process and the access systems are similar. This study shows Mermaid as a tool to effectively explore and expose the limitations to access and offers the opportunity to steer the design of FLOW hardware to boost availability by simply increasing the chance of access for any given day of the wind farms operational life.
Mermaid can be used to aid critical decision making and help lower the cost of operating. If you would like to know more about how Mermaid can be used to model and optimise your marine operations, then get in touch. We offer a free trial, complete with training as well as a full consultancy service.